Export Kubernetes Logs to Azure Log Analytics with Fluent Bit
Every container you run in Kubernetes is going to be generating log data. No one has time to go through and regularly check individual container logs for issues, and so in production environments, it is often required to export these logs to an aggregator for automated analysis.
If you’re using Azure, then Log Analytics may be your log aggregator of choice, and so you need a way to export your container logs into Log Analytics. If you are using AKS, you can deploy the Azure Monitor solution which does this for you, however, if you are running your own cluster, or even using another cloud provider and still want to use Log Analytics, then that it’s not quite so simple. This is where Fluent Bit can help.
Fluent Bit is a popular open source tool for processing and forwarding logs. It can be used to take logs from a variety of systems (one of which is Kubernetes) and process and forward these to multiple destinations. One of these supported destinations is Azure Log Analytics. Other platforms like AWS Elasticsearch, Kafka and InfluxDB, are also supported, you can see a full list here.
While Fluent Bit is not explicitly built for Kubernetes, it does have a native way to deploy and configure it on a Kubernetes cluster using Daemon sets. While the documentation is pretty good, the example configurations all focus around Elasticsearch and Kafka, so I needed to make some tweaks to get it to work with Log Analytics, which are detailed below. You can also find the amended files on my Github here.
At present Fluent Bit is Linux only, so it does not work with Windows Containers running in Kubernetes
Fluent Bit is a powerful tool and can do some pretty useful parsing of log data before it is exported to your log aggregator. I mentioned that if you are using AKS you can use the Azure Monitor solution, but if you want to do some processing of your log data before export, then you may want to consider using something like Fluent Bit, even if you are using AKS.
Deployment
Pre-Requisites
Before we deploy the Fluent Bit Daemon set, we need to deploy some pre-requisite resource:
- Namespace
- Service Account
- Role
- Role Binding
The easiest way to do this is using the YAML files stored in Fluent Bits Github Repo, but before you run the commands below make sure you have read these files and have understood what they will do on your cluster.
To deploy the resources run the command below:
kubectl create namespace logging
kubectl create -f https://raw.githubusercontent.com/fluent/fluent-bit-kubernetes-logging/master/fluent-bit-service-account.yaml
kubectl create -f https://raw.githubusercontent.com/fluent/fluent-bit-kubernetes-logging/master/fluent-bit-role.yaml
kubectl create -f https://raw.githubusercontent.com/fluent/fluent-bit-kubernetes-logging/master/fluent-bit-role-binding.yaml
Config Map
We now need to deploy a config map which contains the settings to be used by Fluent Bits Daemon set. This config map defines which of Fluent Bit’s input and output plugins are used. In our case, we want to use the Kubernetes input and Azure output. The example on the Fluent Bit Github site is for Elasticsearch, so I have updated this to work with Log Analytics.
The critical part for outputting to Log Analytics is the output plugin. The entry in the config map looks like this:
  output-azure.conf: |
    [OUTPUT]
        Name        azure
        Match       *
        Customer_ID ${FLUENT_AZURE_WORKSPACE_ID}
        Shared_Key  ${FLUENT_AZURE_WORKSPACE_KEY}
Here we define we want to use the Azure plugin, to export all the data we receive, and then providing the data needed to connect to the workspace.
- Customer_ID - This is the Log Analytics Workspace ID, the GUID found on the advanced settings page
- Shared_Key - The workspace Key, again found on the advanced settings page
In the entry above, we have configured the values of these to come from environment variables attached to the Daemon set.
In addition to the Azure configuration, the full configuration file also defines:
- Using the Kubernetes Input Plugin
- The Azure Log Analytics Output Plugin
- A Kubernetes Filter, this enriches the data from the logs with metadata about where it has come from. Information such as the pod name, namespace and labels are added to the log entry.
- Parses for common container types - these parse the data in the logs and give them a better structure before export. If the resources you are interested in does not have a parser, you might want to consider building your own.
apiVersion: v1
kind: ConfigMap
metadata:
  name: fluent-bit-config
  namespace: logging
  labels:
    k8s-app: fluent-bit
data:
  # Configuration files: server, input, filters and output
  # ======================================================
  fluent-bit.conf: |
    [SERVICE]
        Flush         1
        Log_Level     info
        Daemon        off
        Parsers_File  parsers.conf
        HTTP_Server   On
        HTTP_Listen   0.0.0.0
        HTTP_Port     2020

    @INCLUDE input-kubernetes.conf
    @INCLUDE filter-kubernetes.conf
    @INCLUDE output-azure.conf

  input-kubernetes.conf: |
    [INPUT]
        Name              tail
        Tag               kube.*
        Path              /var/log/containers/*.log
        Parser            docker
        DB                /var/log/flb_kube.db
        Mem_Buf_Limit     5MB
        Skip_Long_Lines   On
        Refresh_Interval  10

  filter-kubernetes.conf: |
    [FILTER]
        Name                kubernetes
        Match               kube.*
        Kube_URL            https://kubernetes.default.svc:443
        Kube_CA_File        /var/run/secrets/kubernetes.io/serviceaccount/ca.crt
        Kube_Token_File     /var/run/secrets/kubernetes.io/serviceaccount/token
        Merge_Log           On
        K8S-Logging.Parser  On
        K8S-Logging.Exclude Off

  output-azure.conf: |
    [OUTPUT]
        Name        azure
        Match       *
        Customer_ID ${FLUENT_AZURE_WORKSPACE_ID}
        Shared_Key  ${FLUENT_AZURE_WORKSPACE_KEY}

  parsers.conf: |
    [PARSER]
        Name   apache
        Format regex
        Regex  ^(?<host>[^ ]*) [^ ]* (?<user>[^ ]*) \[(?<time>[^\]]*)\] "(?<method>\S+)(?: +(?<path>[^\"]*?)(?: +\S*)?)?" (?<code>[^ ]*) (?<size>[^ ]*)(?: "(?<referer>[^\"]*)" "(?<agent>[^\"]*)")?$
        Time_Key time
        Time_Format %d/%b/%Y:%H:%M:%S %z

    [PARSER]
        Name   apache2
        Format regex
        Regex  ^(?<host>[^ ]*) [^ ]* (?<user>[^ ]*) \[(?<time>[^\]]*)\] "(?<method>\S+)(?: +(?<path>[^ ]*) +\S*)?" (?<code>[^ ]*) (?<size>[^ ]*)(?: "(?<referer>[^\"]*)" "(?<agent>[^\"]*)")?$
        Time_Key time
        Time_Format %d/%b/%Y:%H:%M:%S %z

    [PARSER]
        Name   apache_error
        Format regex
        Regex  ^\[[^ ]* (?<time>[^\]]*)\] \[(?<level>[^\]]*)\](?: \[pid (?<pid>[^\]]*)\])?( \[client (?<client>[^\]]*)\])? (?<message>.*)$

    [PARSER]
        Name   nginx
        Format regex
        Regex ^(?<remote>[^ ]*) (?<host>[^ ]*) (?<user>[^ ]*) \[(?<time>[^\]]*)\] "(?<method>\S+)(?: +(?<path>[^\"]*?)(?: +\S*)?)?" (?<code>[^ ]*) (?<size>[^ ]*)(?: "(?<referer>[^\"]*)" "(?<agent>[^\"]*)")?$
        Time_Key time
        Time_Format %d/%b/%Y:%H:%M:%S %z

    [PARSER]
        Name   json
        Format json
        Time_Key time
        Time_Format %d/%b/%Y:%H:%M:%S %z

    [PARSER]
        Name        docker
        Format      json
        Time_Key    time
        Time_Format %Y-%m-%dT%H:%M:%S.%L
        Time_Keep   On
        # Command      |  Decoder | Field | Optional Action
        # =============|==================|=================
        Decode_Field_As   escaped    log

    [PARSER]
        Name        syslog
        Format      regex
        Regex       ^\<(?<pri>[0-9]+)\>(?<time>[^ ]* {1,2}[^ ]* [^ ]*) (?<host>[^ ]*) (?<ident>[a-zA-Z0-9_\/\.\-]*)(?:\[(?<pid>[0-9]+)\])?(?:[^\:]*\:)? *(?<message>.*)$
        Time_Key    time
        Time_Format %b %d %H:%M:%S
Save this somewhere on your machine, then run the command below to create the config map.
kubectl create -f fluent-bit-configmap.yaml
Where “fluent-bit-configmap.yaml” is the path to the config map file.
Daemonset
Now that we have our configuration setup, we need to create a Daemon set, which deploys a Fluent Bit pod on every node to collect the required data. Again, the example on Github is for Elasticsearch, so we need to amend this slightly. The only change we need to make is to change the environment variables passed into the pod to be the workspace ID and Key.
To keep my workspace key private, I have created a secret to store the ID and Key. I created the YAML file below to define the secret. The values are base64 encoded versions of the ID and Secret:
apiVersion: v1
kind: Secret
metadata:
  name: LogAnalytics
type: Opaque
data:
  WorkSpaceID: xxxxxxxxxxxxxx
  WorkspaceKey: xxxxxxxxxxxxxxxxx
I then create the secret by running:
kubectl apply -f ./secret.yaml
Now, we can amend the Daemonset YAML to use these secrets:
apiVersion: extensions/v1beta1
kind: DaemonSet
metadata:
  name: fluent-bit
  namespace: logging
  labels:
    k8s-app: fluent-bit-logging
    version: v1
    kubernetes.io/cluster-service: "true"
spec:
  template:
    metadata:
      labels:
        k8s-app: fluent-bit-logging
        version: v1
        kubernetes.io/cluster-service: "true"
      annotations:
        prometheus.io/scrape: "true"
        prometheus.io/port: "2020"
        prometheus.io/path: /api/v1/metrics/prometheus
    spec:
      containers:
      - name: fluent-bit
        image: fluent/fluent-bit:1.0.6
        imagePullPolicy: Always
        ports:
          - containerPort: 2020
        env:
        - name: FLUENT_AZURE_WORKSPACE_ID
          valueFrom:
            secretKeyRef:
              name: LogAnalytics
              key: WorkSpaceID
        - name: FLUENT_AZURE_WORKSPACE_KEY
          valueFrom:
            secretKeyRef:
              name: LogAnalytics
              key: WorkspaceKey
        volumeMounts:
        - name: varlog
          mountPath: /var/log
        - name: varlibdockercontainers
          mountPath: /var/lib/docker/containers
          readOnly: true
        - name: fluent-bit-config
          mountPath: /fluent-bit/etc/
      terminationGracePeriodSeconds: 10
      volumes:
      - name: varlog
        hostPath:
          path: /var/log
      - name: varlibdockercontainers
        hostPath:
          path: /var/lib/docker/containers
      - name: fluent-bit-config
        configMap:
          name: fluent-bit-config
      serviceAccountName: fluent-bit
      tolerations:
      - key: node-role.kubernetes.io/master
        operator: Exists
        effect: NoSchedule
      - operator: "Exists"
        effect: "NoExecute"
      - operator: "Exists"
        effect: "NoSchedule"
We then deploy this using the command below:
kubectl create -f fluent-bit-ds.yaml
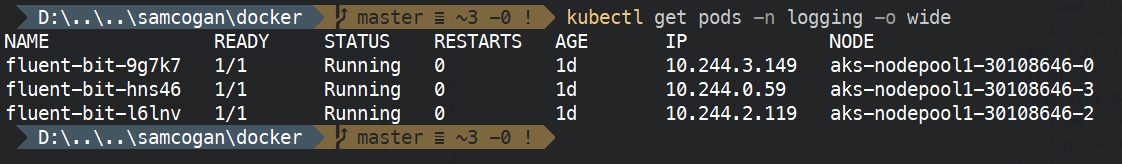
Once that has run, if we run “kubectl get pods -n logging” on the cluster, we should see the Daemon set pods created.
Log Data
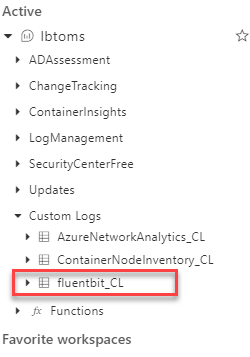
Once Fluent Bit has been running for a few minutes, we should start to see data appear in Log Analytics. To check, open your workspace, go to logs, and under the “Custom Logs” section, you should see “fluentbit_CL”.
If you select the view icon (the eye to the right), it will create the query below, to get some sample data:
fluentbit_CL
| limit 50
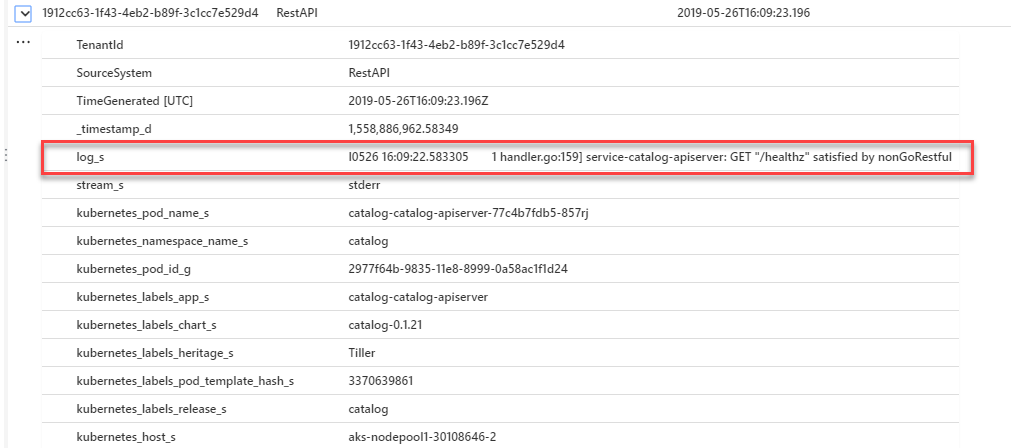
Run this query, and you should get some records returned. If you expand a record, you will be able to see the log data, plus all the Kubernetes metadata. The log data itself is in the “log_s” field.
Now the data is in Log Analytics, you can create queries using the Kusto Language to do whatever you need with the data.
Take-Away
Fluent Bit is a powerful tool for collecting and processing log data and sending it where it needs to go. It is also reasonably easy to set up and get data exporting to Log Analytics (or any other log aggregator), yet has the potential to allow you to do some very sophisticated filtering, parsing and process if you need to.
If your using AKS and you simply want to get log data into Log Analytics, then the Azure Monitor plugin is probably the easiest way to do this. However, if you are not using AKS, or if you are but need more powerful processing of your logs, then Fluent Bit might be a useful tool.