Diagram as Code with Diagrams
If you read this blog regularly, you’ll know I’m a big proponent of infrastructure as code, and I spend quite a bit of my time working with it. Another thing I spend a reasonable amount of time doing is drawing diagrams, architecture diagrams, network diagrams etc. Usually, I end up creating these in Visio. I’m not sure I’ve ever met anyone who enjoys working with Visio, but it does get the job done most of the time, but I’m always happy to look at alternatives.
So, when I stumbled upon “Diagrams” the other day, which allows you to create diagrams as code, I was very interested. Diagrams is a Python-based tool that allows you to define your diagrams as Python code and run them to generate a png diagram as a result. Because your diagrams are Python code, it means you can store them in version control, get version history, pull requests etc. (which is not achievable with Visio’s binary file format). It also means that anyone who understands some basic Python can edit the diagram rather than needing to have a copy of Visio.
Diagram has pre-configured libraries of symbols (or nodes as it calls it) for the common cloud providers, Kubernetes, on-premises, programming and more. You can see the complete list here. It also supports custom nodes you can add if the one you want isn’t present. We will take a look at that later.
For the rest of this article, let’s look at how Diagrams works and how to get up and running.
Installation
Diagrams is a Python application, so you do need to have Python 3 installed. If you’re on Windows like I am, you can use the excellent package manager Chocolatey to install this quickly, or if you prefer any of the other ways to install Python, that will work too.
choco install Python
Diagrams also requires Graphviz to be installed; we can install that with Chocolatey as well. There seems to be a bug with the latest version of Graphviz at the time of writing, so I would recommend installing version 2.4.6.1 if you have this issue.
choco install Graphviz --version 2.46.1
Finally, we can go ahead and install Diagrams; we can use PIP, the Python package manager, to install it.
pip install diagrams
That’s it; we’re now ready to create some diagrams.
Create a Diagram
Now everything is installed, we can create our first diagram. Open your editor of choice and create a new python file (.py). The first thing we need to do is import the libraries for the particular “nodes” we want in the diagram. In Diagram speak, a node is a specific resource, server, database etc., that you want to show. You can find the list of the nodes on the Diagram site. We want to look at Azure nodes, so we can find them here. We will create a diagram using App Service, Azure SQL and Azure Storage; these are all in separate libraries, so we would import them as below. We are also going to import some of the essential Diagrams components.
from diagrams import Cluster, Diagram
from diagrams.azure.compute import AppServices
from diagrams.azure.database import SQLDatabases
from diagrams.azure.storage import BlobStorage
Next, we need to set up our diagram; this is the top-level resource under which everything else sits. We’re just going to call the diagram method with a name for our diagram.
with Diagram("Azure Application", show=False):
There are several options you can pass to this method. The “show=false” value means that Python won’t automatically open the diagram when it is created. You can find all the methods available here.
Now we have set up the diagram, and we are ready to create the particular resources. This is as simple as calling the specific class with a name you want to give the resource, so to create an app service called “appService1”, we would do:
appService1 = AppServices("appService1")
We’ll then add in our DB and storage account now as well, so our complete code looks like this:
from diagrams import Cluster, Diagram
from diagrams.azure.compute import AppServices
from diagrams.azure.database import SQLDatabases
from diagrams.azure.storage import BlobStorage

with Diagram("Simple Web Service with DB Cluster", show=False):
    appService1 = AppServices("appService1")
    sqlDb1=SQLDatabases("sqlDb1")
    storage1=BlobStorage("storage1")
This is a working diagram; we can create it by running Python against this file:
python <nameOfFile>.py
This will output a PNG file in the same folder as the Python file. If you open it up, it will look like this.
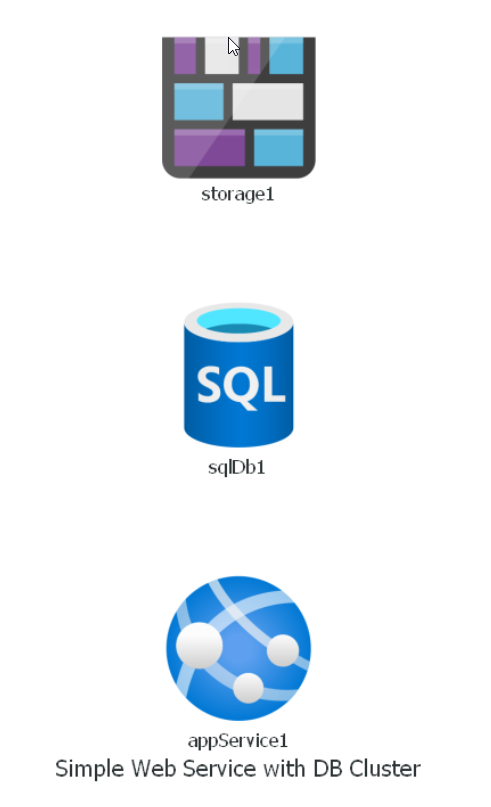
We’ve got all the resources, but we need to order and link them up now; otherwise, it’s just a page of pretty images. To do that, we use the “»” notation to join nodes together. So to link the web app to SQL, we would do
appService1 >> sqlDb1
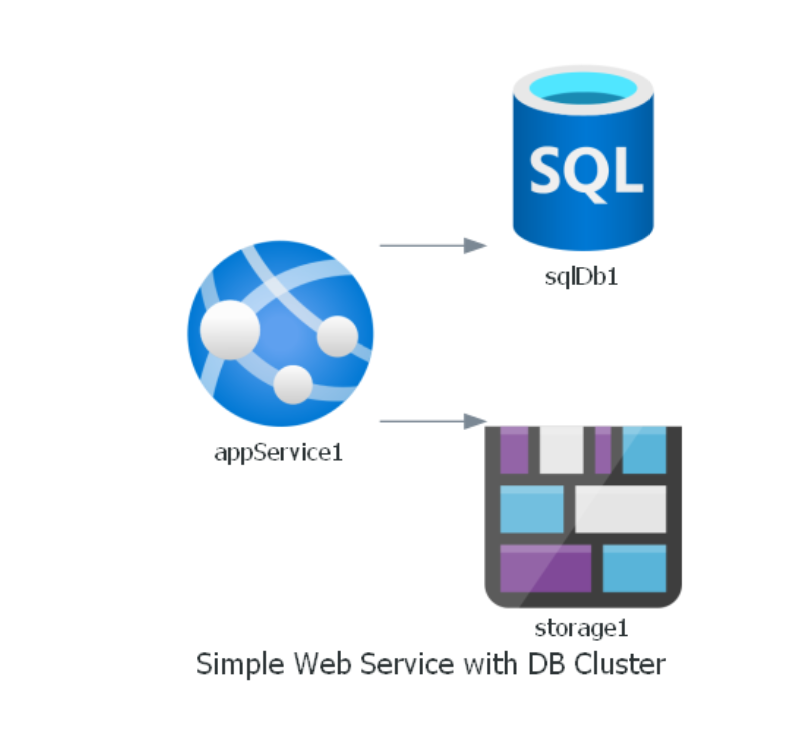
In our example, we want the web app to be talking to both the DB and the storage account, so we can put them in an array and link to that:
  appService1 >> [sqlDb1,
                    storage1]
So now our diagram looks like this:
Clusters
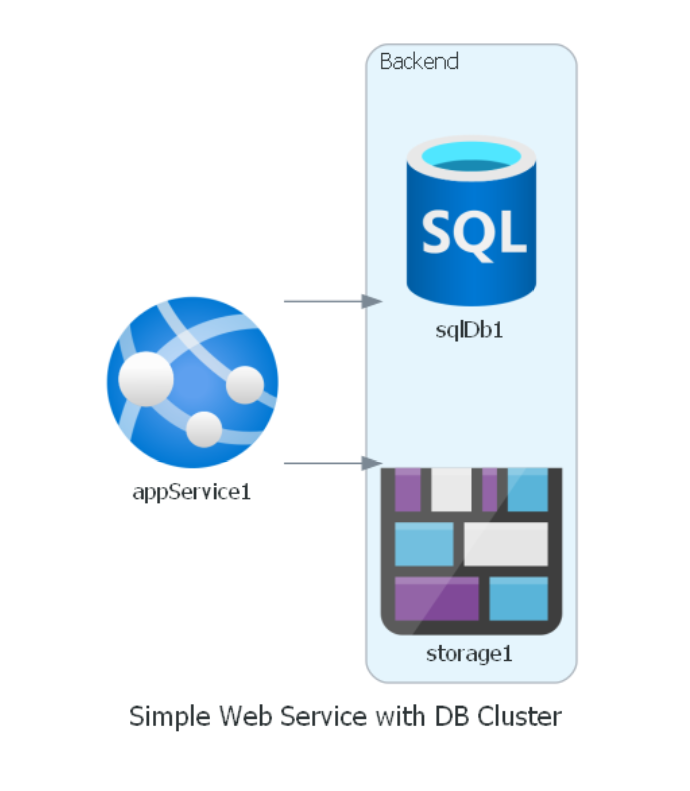
An additional feature of Diagrams is called “Clusters”, which allows us to wrap up some nodes in a container to denote some clustering or association of resources. In our diagram, let’s say the SQL DB and storage form the “backend” of our application and create a cluster for that. Our diagram code now looks like this:
from diagrams import Cluster, Diagram
from diagrams.azure.compute import AppServices
from diagrams.azure.database import SQLDatabases
from diagrams.azure.storage import BlobStorage

with Diagram("Simple Web Service with DB Cluster", show=False):
    appService1 = AppServices("appService1")

    with Cluster("Backend"):
        sqlDb1 = SQLDatabases("sqlDb1")
        storage1 = BlobStorage("storage1")

    appService1 >> [sqlDb1,
                    storage1]
You can see we have created a cluster called “Backend”, which contains SQL and Blob storage, but our app service still has links between it and the underlying resources. Now our diagram looks like this:
Custom Nodes
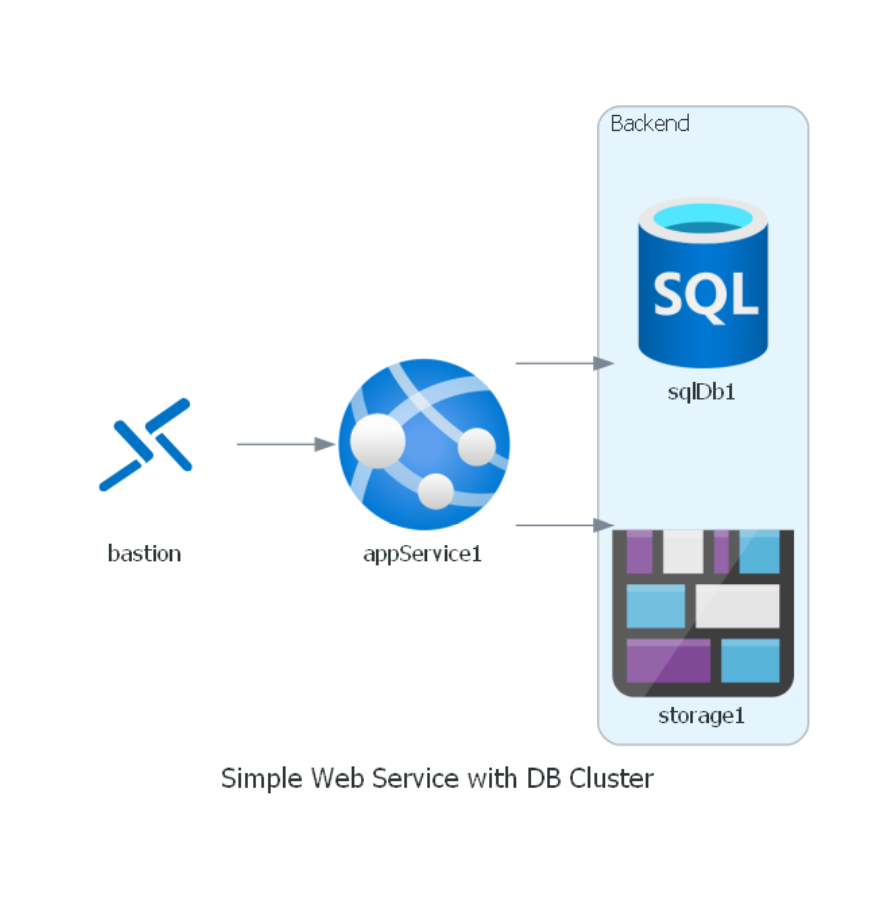
Diagrams has a large number of node icons for commons services; however, if you find that it is missing one you need, you can still deal with this through custom nodes. There are two options to do this: either pull the image directly from a remote URL or a file stored locally. For example, the current Azure node list is missing an Azure Bastion Icon, so let’s set that up as a custom icon.
Remote Image
To pull from a remote URL, we need to specify the URL and file name and then use the url_retrieve function to download the image.
    bastion_url = "https://res.cloudinary.com/samcogan/image/upload/v1624135418/bastion_qfjova.png"
    bastion_icon = "bastion_qfjova.png"
    urlretrieve(bastion_url, bastion_icon)
    bastion = Custom("bastion", bastion_icon)
Now we have a node called “bastion”, which can be used like any other node.
Local Image
For using a local image, we need to store the file locally on our machine, ideally close to the Python file, then reference its location when creating the node:
bastion = Custom("bastion", "./my_resources/bastion_qfjova.png")
Now that we have our custom node, our diagram looks like this (and yes, I know you can’t use Bastion to access a web app!):
The final full set of code looks like this:
from diagrams import Cluster, Diagram
from diagrams.azure.compute import AppServices
from diagrams.azure.database import SQLDatabases
from diagrams.azure.storage import BlobStorage
from diagrams.custom import Custom
from urllib.request import urlretrieve


with Diagram("Simple Web Service with DB Cluster", show=False):
    bastion_url = "https://res.cloudinary.com/samcogan/image/upload/v1624135418/bastion_qfjova.png"
    bastion_icon = "bastion_qfjova.png"
    urlretrieve(bastion_url, bastion_icon)
    bastion = Custom("bastion", bastion_icon)

    appService1 = AppServices("appService1")

    with Cluster("Backend"):
        sqlDb1 = SQLDatabases("sqlDb1")
        storage1 = BlobStorage("storage1")

    bastion >> appService1 >> [sqlDb1,
                    storage1]
Summary
Diagrams is a really interesting concept for creating diagrams in a programmatic way, rather than relying on a more visual tool like Vision. I was quite happy not to have to deal with drawing connectors in the right place! Using Python to create diagrams has some real benefits in terms of being able to version control and collaborate on diagrams, especially if you’ve got developers working on these diagrams.
On the downside, using Diagram requires you to use Python, although it’s not particularly complicated Python. This might be a blocker if you are looking to collaborate with non-developers. I’m also unsure how things will scale when you get too much larger diagrams with complicated connections, which often need to be tweaked by hand. This is something I’ll be looking to test out.
Further Reading
- Diagrams Website and Docs - https://diagrams.mingrammer.com/
- Diagrams GitHub Repo - https://github.com/mingrammer/diagrams