Debugging Pulumi Infrastructure as Code in Visual Studio
If you’ve read any of my previous articles on Pulumi, you’ll know I’m a fan of the use of actual code to write Infrastructure as Code, in my case using C# and Visual Studio (or VS Code). Anyone who writes any code regularly will be familiar with using the debugging tools in their IDE to find problems. So when I hit some issues with my Pulumi code, the first thing I wanted to do was use the debugger to dig into the issue.
Unlike when writing an executable or a web app, Pulumi code doesn’t have an easy press F5 to debug option, at least not yet,. This is down to the fact that you are kicking off your Pulumi execution from the Pulumi CLI rather than in your IDE. But it is possible to get the debugger to work in .net languages using Visual Studio.
Pause For Debugger
The first thing we need to do is to get Pulumi to pause once it starts executing to wait for us to attach a debugger. If we don’t do this, then we are likely to miss the window.
If you just want to keep things simple and temporarily enable the debugger, then you can add the following to the top of your Pulumi C# stack:
while (!Debugger.IsAttached)
{
    Thread.Sleep(100);
}
This will pause the Pulumi execution until you attach the debugger (detail in the next step). Note that this will break twice, first on the “Preview” step and then on the “Up” stage; you will need to attach the debugger each time.
If you want to get a bit fancier and have this only trigger when you are in debug mode and only on the “up” step, you can do something like this:
bool.TryParse(Environment.GetEnvironmentVariable("PULUMI_DEBUG"), out var debug);

if (debug && Pulumi.Deployment.Instance.IsDryRun)
{
    while (!Debugger.IsAttached)
    {
        Thread.Sleep(100);
    }
}
This will check for an environment variable called “PULUMI_DEBUG” (you can name this anything you want, it’s not a Pulumi specific one) being set to true. It will then check if you’re currently doing a dry run (preview) and then only wait for the bugger if you are in debug mode and it’s not a dry run. You can then leave this in your code permanently and only trigger it when setting that environment variable.
Attaching Debugger
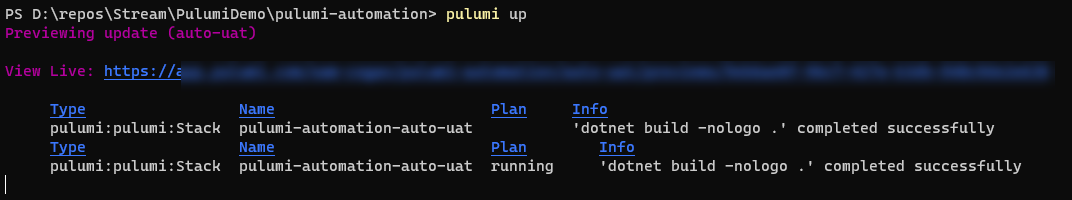
Now that we have the code pausing at the right point, we need to attach the debugger. Run your code using the Pulumi CLI as you normally would, and you will find that it pauses after running the build:
At this point, we are ready to attach the debugger. To do this, we need to know what the name or ID of the running executable is. The name is usually the same as your project in Visual Studio, but if you can’t find it, the easiest way to locate it is to download a copy of Microsoft SysInternals Process Explorer. If you run this, you will be able to identify the top-level CLI instance you ran Pulumi Up from and then expand the tree to find the actual project executable. This will usually be under the “Explorer” section.

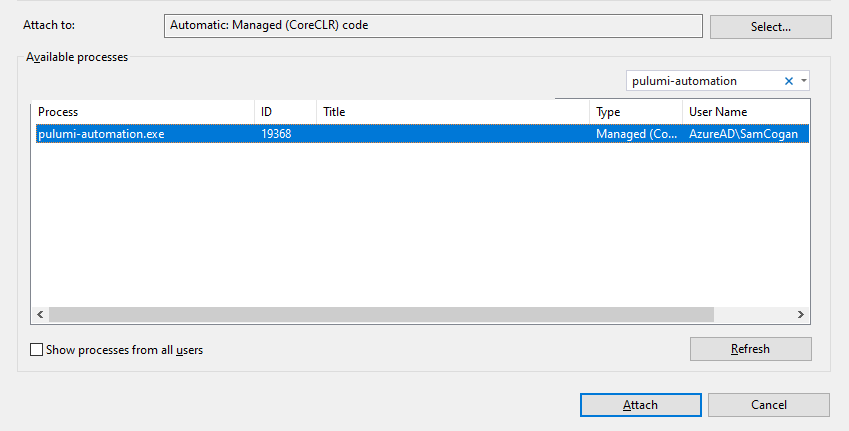
In this example, I am looking for the exe called “pulumi-automation.exe” or process ID 19368.
Back in Visual Studio, go to the Debug menu and then click on the “Attach to Process” option.

In the window that opens, search for the executable name or process ID. When you find it, select it and click “Attach”.
At this point, Visual Studio will launch the debugger and attach it to your Pulumi process. Pulumi will detect this and will move on with the rest of your code, pausing at any breakpoints or errors as you would expect from your debugger.

As mentioned, if you attach the debugger for the “Preview” part, it will pause again at the “Up” part, and you will need to attach the debugger again. The process name will be the same, but the process ID will change.