Collecting Prometheus Metrics with Azure Monitor
Microsoft announced a new preview this week which I think is a pretty big deal. This preview allows for the collection of Prometheus metrics in Azure monitor. If you’ve used Azure Kubernetes Service (AKS), you may know you have the option to connect your AKS cluster up to Azure monitor. If you connect your cluster, Azure monitor deploys a collector agent pod. This pod will pull in metrics from your cluster and nodes and make this available to you in Azure Monitor. So far, this has been limited to collecting standard metrics about the nodes, cluster and pods, so things like CPU and Memory usage etc. These metrics are handy, but often, you need to collect more detailed metrics or metrics that are very specific to your application, and this is where Prometheus comes in.
Prometheus
Prometheus is an open-source monitoring platform that is well on its way to becoming the de facto way to monitor container workloads (although it is not just limited to that). Prometheus provides a set of applications which collect monitoring data from your applications, containers and nodes by scraping a specific endpoint. These services collate this data and provide a way to query and alert on the data.
In addition to the applications to collect monitoring data, Prometheus provides an easy way for you to expose metrics from your own applications using a set of client libraries and a standardised format for presenting the metrics. This standard format is very simple and just expects you to provide a /metrics endpoint on your application, which presents metrics in a standard text format, looking a bit like below:
# HELP go_gc_duration_seconds A summary of the GC invocation durations.
# TYPE go_gc_duration_seconds summary
go_gc_duration_seconds{quantile="0"} 7.6e-06
go_gc_duration_seconds{quantile="0.25"} 1.65e-05
go_gc_duration_seconds{quantile="0.5"} 1.79e-05
go_gc_duration_seconds{quantile="0.75"} 2.41e-05
go_gc_duration_seconds{quantile="1"} 0.000901405
go_gc_duration_seconds_sum 0.002694815
go_gc_duration_seconds_count 71
# HELP go_goroutines Number of goroutines that currently exist.
# TYPE go_goroutines gauge
go_goroutines 89
# HELP go_memstats_alloc_bytes Number of bytes allocated and still in use.
# TYPE go_memstats_alloc_bytes gauge
go_memstats_alloc_bytes 7.935544e+06
# HELP go_memstats_alloc_bytes_total Total number of bytes allocated, even if freed.
# TYPE go_memstats_alloc_bytes_total counter
go_memstats_alloc_bytes_total 3.86012584e+08
# HELP go_memstats_buck_hash_sys_bytes Number of bytes used by the profiling bucket hash table.
# TYPE go_memstats_buck_hash_sys_bytes gauge
go_memstats_buck_hash_sys_bytes 1.512257e+06
# HELP go_memstats_frees_total Total number of frees.
# TYPE go_memstats_frees_total counter
go_memstats_frees_total 3.956944e+06
# HELP go_memstats_gc_cpu_fraction The fraction of this program's available CPU time used by the GC since the program started.
# TYPE go_memstats_gc_cpu_fraction gauge
go_memstats_gc_cpu_fraction 4.171285643928631e-05
The Prometheus monitoring applications call these endpoints regularly and ingest and record the data centrally to then be queried.
Azure Monitor & Prometheus
This new preview extends the Azure Monitor for Containers functionality to allow collecting data from any Prometheus endpoints. So if you instrument your application with metrics using the Prometheus libraries and provide the correct endpoint, then Azure Monitor will scrape and pull that data in, regardless of what the data is.
This feature is really exciting for those using Azure Monitor and Log Analytics for collecting, aggregating and alerting on monitoring data because:
- It removes the need to run all the Prometheus collector and alerting infrastructure on your AKS cluster. All you need is instrumented applications and the Azure Monitor collector
- If you run multiple Kubernetes clusters, it removes the need to find a way to centralise your Prometheus data globally
- Azure Monitor takes care of the high availability and disaster recovery for your monitoring data
- If you already use Azure Monitor/Log analytics for your monitoring data, you can continue with a central point for collecting, displaying and alerting on this
If you have already invested in Azure Monitor/Log Analytics as your single point of truth for monitoring and you are using or looking to use Kubernetes, then this new feature could be handy.
As with anything, it’s not perfect. There are a few things you need to be aware of:
It’s in preview, so no SLA yetThis is now GA- There can be some delay between data getting collected on the cluster and it arriving at Log analytics. At present, I see around 2-4 minutes delay
- The collected data is stored in Log Analytics, which has a cost per GB. You will want to tune your collection criteria and retention to make sure costs are what you expect
- Some settings for how to collect data, as we will see later, are cluster-wide, which can limit flexibility
Setup Prometheus Log Collection
Enable Azure Monitor for Containers
If you haven’t enabled this already, you will need to turn on Azure Monitor for containers. See this article for how to quickly set this up on AKS.
Once you have this enabled, run the following command:
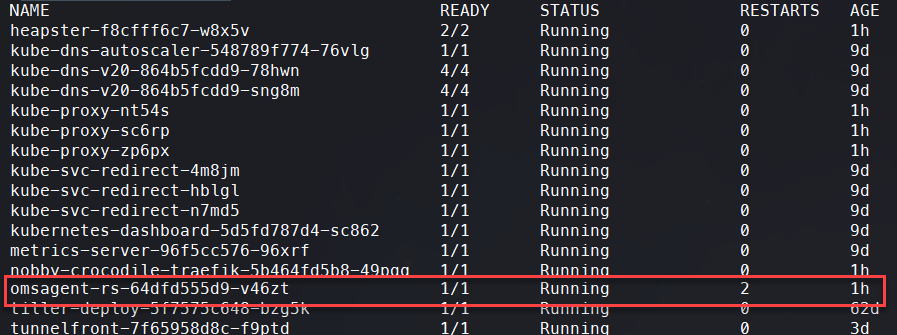
kubectl get pods -n kube-system
You should see that you have an “omsagent” pod running.
Create Monitoring Configuration
Now the monitoring agent is running, it will collect the default data about nodes, cluster and containers. To get our custom Prometheus metrics, we need to tell it what we want to collect. We do this using a ConfigMap. Microsoft has provided a default ConfigMap that we can edit as required, so the first step is to download this from Github.
Once we have this downloaded, we need to make some changes to tell it what to collect data from. In the file, we need to scroll down until we find the section labelled " [prometheus_data_collection_settings.cluster]”. This should look like this:
    [prometheus_data_collection_settings.cluster]
        # Cluster level scrape endpoint(s). These metrics will be scraped from the agent's Replicaset (singleton)
        #Interval specifying how often to scrape for metrics. This is duration of time and can be specified for supporting settings by combining an integer value and time unit as a string value. Valid time units are ns, us (or µs), ms, s, m, h.
        interval = "1m"
        ## Uncomment the following settings with valid string arrays for prometheus scraping
        #fieldpass = ["metric_to_pass1", "metric_to_pass12"]

        #fielddrop = ["metric_to_drop"]

        # An array of urls to scrape metrics from.
        # urls = ["http://myurl:9101/metrics"]
        # An array of Kubernetes services to scrape metrics from.
        # kubernetes_services = ["http://my-service-dns.my-namespace:9102/metrics"]
        # When monitor_kubernetes_pods = true, replicaset will scrape Kubernetes pods for the following prometheus annotations:
        # - prometheus.io/scrape: Enable scraping for this pod
        # - prometheus.io/scheme: If the metrics endpoint is secured then you will need to
        #     set this to `https` & most likely set the tls config.
        # - prometheus.io/path: If the metrics path is not /metrics, define it with this annotation.
        # - prometheus.io/port: If port is not 9102 use this annotation
        monitor_kubernetes_pods = false
Most of this is commented out, so we need to uncomment the sections we want, which will depend on how we want to define the collection of data. There are 3 ways we can do this:
- Provide an array of URLs for scraping endpoints
- Provide an Array of Kubernetes services for scraping
- Enable monitoring of any pods with specific annotations
Using options 1 or 2 is pretty simple; we provide the full URL to the endpoint where we can find the metrics. This is going to be specific to your pod and application.
Option 3 is more generic. If you enable this option, then Azure Monitor will look for any pods with a specific annotation and attempt to scrape these. By default, it is looking for “prometheus.io/scrape” annotation on a pod to be set to true. If that is the case, then it will attempt to hit the /metrics endpoint on port 9102. All of these options can be overridden to specify a different annotation, path and port. However, these settings are cluster-wide, so if you want to use this generic option, then all your pods need to be configured to use the same options.
You can use a combination of these methods, so you could use option 3 as the default and where you know you have pods that do not comply with these settings you can add them specifically in the URL or service section. This is what I have done with my cluster, where I know I have one service which exposes its metrics on port 80 rather than 9102. So my configuration looks like this:
prometheus-data-collection-settings: |-
    # Custom Prometheus metrics data collection settings
    [prometheus_data_collection_settings.cluster]
        # Cluster level scrape endpoint(s). These metrics will be scraped from agent's Replicaset (singleton)

        #Interval specifying how often to scrape for metrics. This is duration of time and can be specified for supporting settings by combining an integer value and time unit as a string value. Valid time units are ns, us (or µs), ms, s, m, h.
        interval = "1m"

        ## Uncomment the following settings with valid string arrays for prometheus scraping
        #fieldpass = ["metric_to_pass1", "metric_to_pass12"]

        #fielddrop = ["metric_to_drop"]

        # An array of urls to scrape metrics from.
        urls = ["http://nobby-crocodile-traefik-dashboard.kube-system.svc.cluster.local/metrics"]

        # An array of Kubernetes services to scrape metrics from.
        # kubernetes_services = ["http://my-service-dns.my-namespace:9102/metrics"]

        # When monitor_kubernetes_pods = true, replicaset will scrape Kubernetes pods for the following prometheus annotations:
        # - prometheus.io/scrape: Enable scraping for this pod
        # - prometheus.io/scheme: If the metrics endpoint is secured then you will need to
        #     set this to `https` & most likely set the tls config.
        # - prometheus.io/path: If the metrics path is not /metrics, define it with this annotation.
        # - prometheus.io/port: If port is not 9102 use this annotation
        monitor_kubernetes_pods = true
You also have the option to either specify only the metrics you want to collect or to drop specific metrics with the “fieldpass” and “fielddrop” section. Again these are cluster-wide.
You will also notice there is a “[prometheus_data_collection_settings.node]” section in this file. We won’t delve into this in this article, but this would allow you to customise the node level metrics the collector is retrieving.
Once you have this file as you want, save it somewhere as a .yaml file.
Apply Monitoring Configuration
Now that we have created the ConfigMap YAML file, we need to deploy this to the cluster. To do this run the following command:
Kubectl apply -f <path to YAML file>
You should see a message indicating that the “container-azm-ms-agentconfig” has been created successfully. At this point, the monitoring agents will restart, you can check all is working by checking the logs of the agent.
To do this, first, we need to get the name of the agent pod. Run the command below to list the pods in the Kube-System namespace.
kubectl get pods -n kube-system
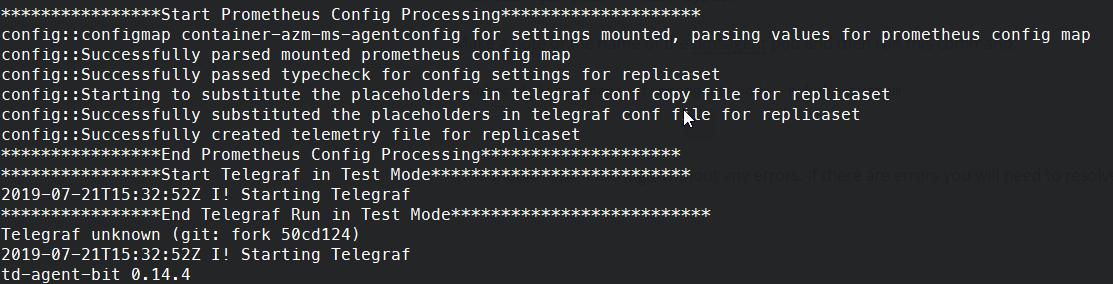
Make a note of the name of the omsagent pod and then run this command:
kubectl logs <name of omsagent pod> -n kube-system
This command should return the logs without any errors. If there are errors, you will need to resolve them.
View Log Data
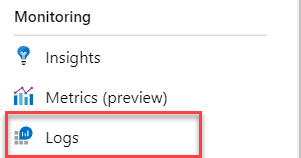
At this point, the collector should start sending data to Azure Monitor. As I mentioned, there can be a bit of a delay to this, so you may want to wait a few minutes. Once your ready head over to the Azure portal and access the logs section of Azure Monitor. You can do this either by going to your AKS cluster and going to the logs section:
Alternatively, by going to the Log Analytics workspace in use and going to the log section in that. We can first do a quick query to check that we are seeing Prometheus data being logged. Go to the query window and enter the query below:
InsightsMetrics
| where Namespace == "prometheus"
This query should then return a list of metrics from the Prometheus namespace, which you can check for the data you expect to be exported. It should match the data from the /metrics page of your application but in Log Analytics format.
Create Queries
Now that we know the data is in place, we can look at creating some more interesting queries.
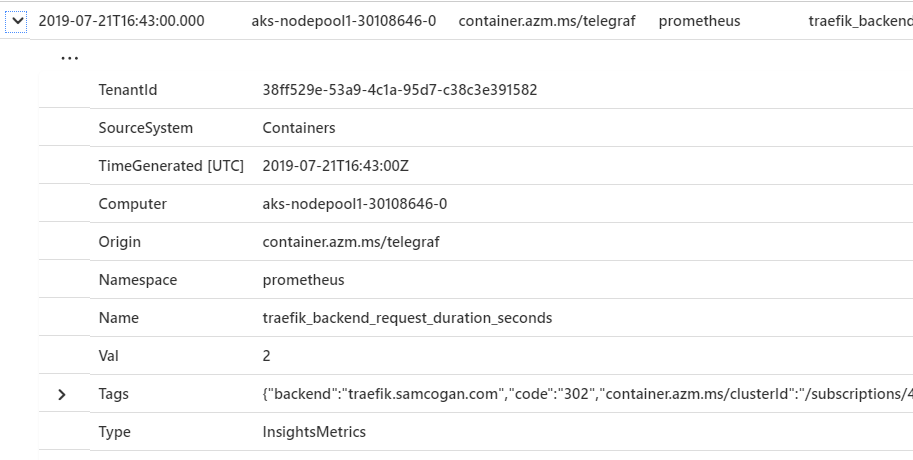
If your data is being categorised or sliced by Prometheus, then much of this data will be translated into tags. You can then use these queries to filter your data. If we look at a specific example, I am pulling in metrics from Traefik, the application I am using for cluster Ingress. In Prometheus the metrics for “traefik_backend_requests_total”, I get this data:
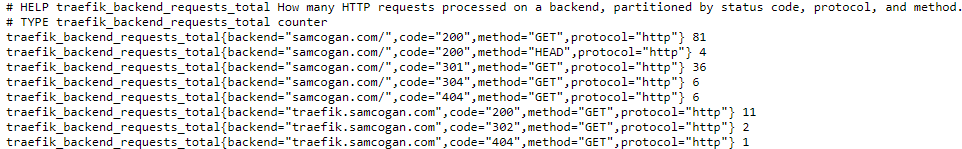
As you can see, it is being split by site, and then by response code and method. In Log Analytics, these all show up as tags:
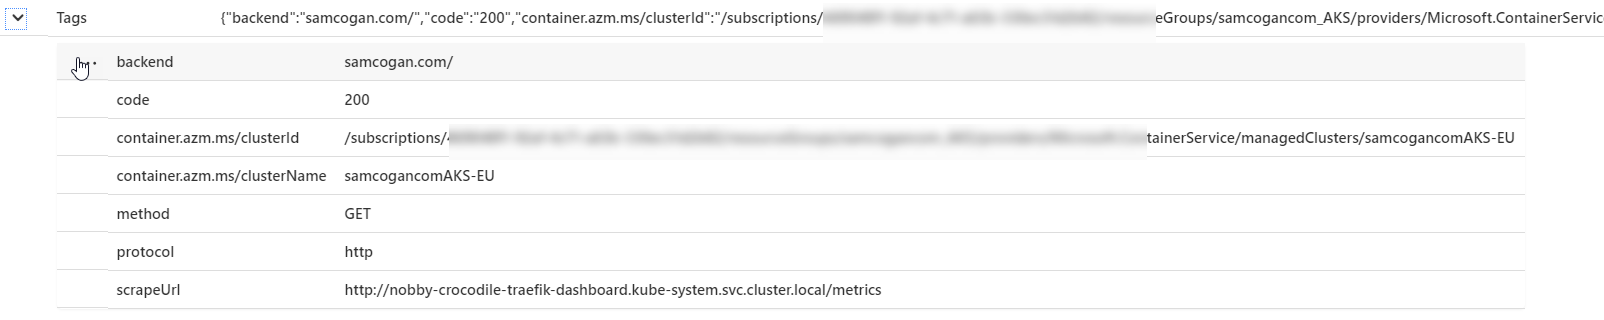
We can then use these tags to filter our query. So in this example I am only interested in requests for samcogan.com which get a 200 response and are using GET. My Log Analytics query will look like this:
InsightsMetrics
| where Namespace == "prometheus"
| where Name == "traefik_backend_requests_total"
| where parse_json(Tags).backend == "samcogan.com/"
| where parse_json(Tags).code == 200
| where parse_json(Tags).method == "GET"
| summarize avg(Val) by bin(TimeGenerated, 1m)
| order by TimeGenerated asc
This query will return data that looks like this:
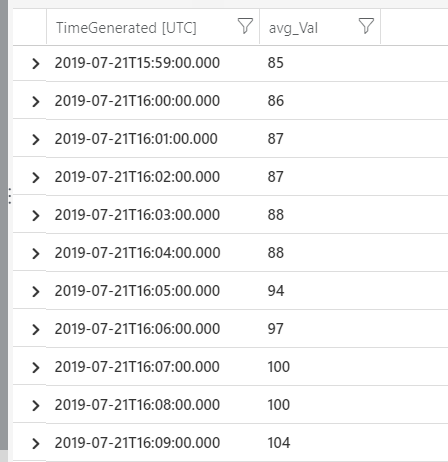
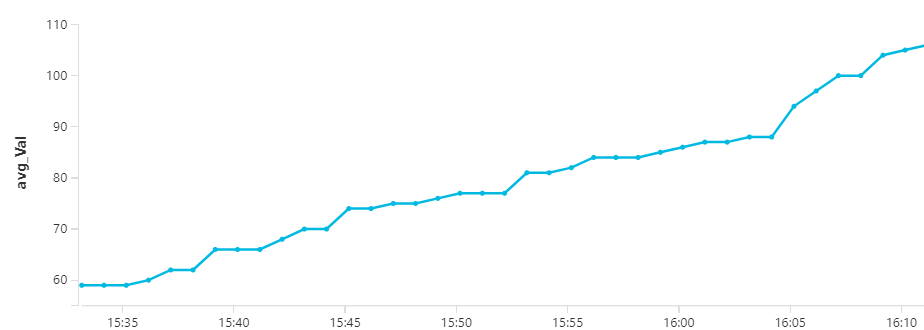
These results can then be turned into a chart like this:
Summary
This new functionality is, I think, going to be useful. Being able to stick with a standardised and straightforward method for instrumenting applications should make life easier for developers. Not needing to deploy and manage a complex Prometheus environment with global aggregation and availability will make things much simpler for those running clusters. Finally, have this data in a single place, where it can be queried and alerted on will be a big help for operations.
Some people will already be running full-blown Prometheus setups in Azure and will be quite happy to stick with that. But for those who want to avoid doing that, while still getting all the data they need, this will be very helpful.