Visualise your Azure Resource with Resource Graph Explorer
I’ve posted before about Azure Resource Graph and how it’s a powerful tool for explorer your Azure resources to understand what you have, what it is doing, and what you are paying for. One of the downsides to this tool however was that it was purely CLI/PowerShell based and so there was no way to visualise the data beyond the JSON that it returned.
I’m happy to report, this has changed. Back in May the portal team released an update which includes a preview of a new feature called Azure Resource Graph Explorer. This tool allows you to run Resource Graph queries in the portal, just like you would with other Kusto based tools like Log Analytics and App Insights. The best bit of this new explorer is that we can create charts of our data, and even pin these to an Azure Dashboard.
Creating Charts with Resource Graph Explorer
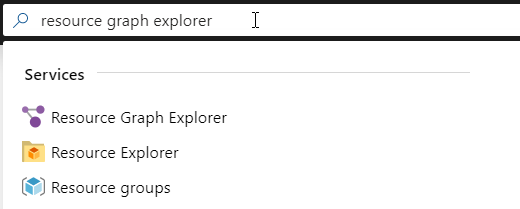
You’ll find Resource Graph Explorer in the Azure Services list.
Once opened, you’re presented with the familiar search interface used by Log Analytics and similar, to enter your query.
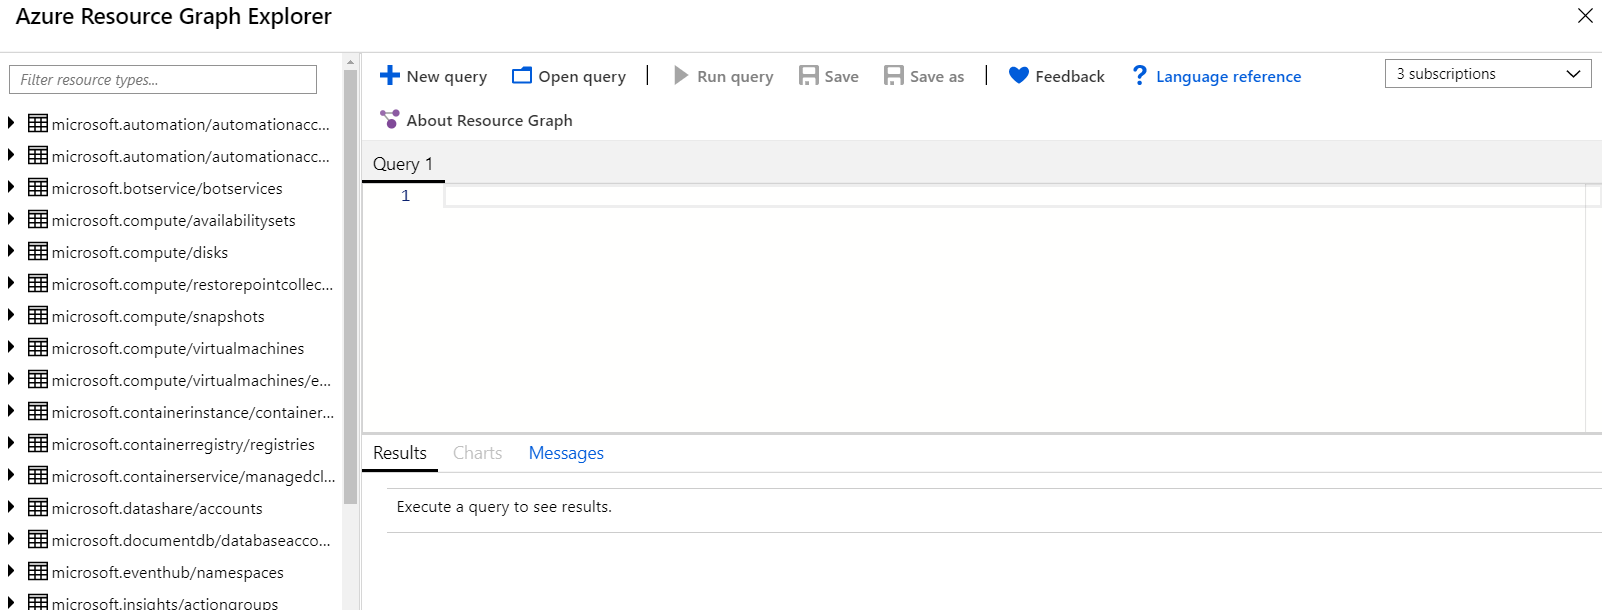
Resource Explorer
You’ll notice on the left-hand side you have an explorer which lists all the available Azure resource types. If you expand this resource, you will see all the properties and subtypes. If you select the button next to these resources, you have the option to “Explore distinct values of…” if you select this you populates the query window with some pre-defined queries about this resource.
Query Window
The query window is where we can input our Resource Graph query, this provides some limited autocompletion and supports only the elements of the Kusto language supported by resource graph.
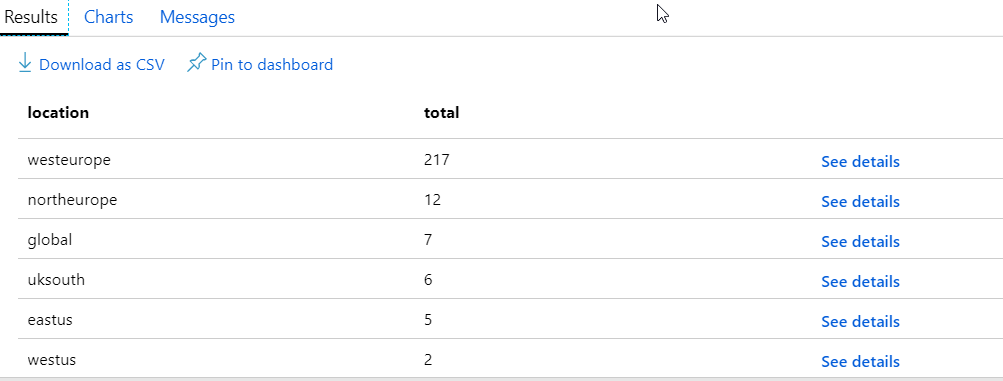
We can enter the same queries we used from the CLI and execute them to see the results in text form in the Results Tab. As an example, let’s look at the query from the previous article that provides a count of all resource per region, so we can see where our most popular regions are.
summarize count() by location | project total=count_, location | order by total desc
If we run this, we can see the text results:
If we click on the Charts tab, we have the option to create a chart of this data. At present, we only have two options for charts, bar or donut. If we select donut with this query, we will see an error. The chart expects to see two columns, the first for the label, the second value. In our query, these columns are reversed, so we do need to amend our query to fit this.
summarize count() by location | project location, total=count_| order by total desc
Now are columns are in the correct order, so if we select chart, it generates our chart. In its current form, the data we have generates a warning that there are too many data points, however, if we click ok it will render.
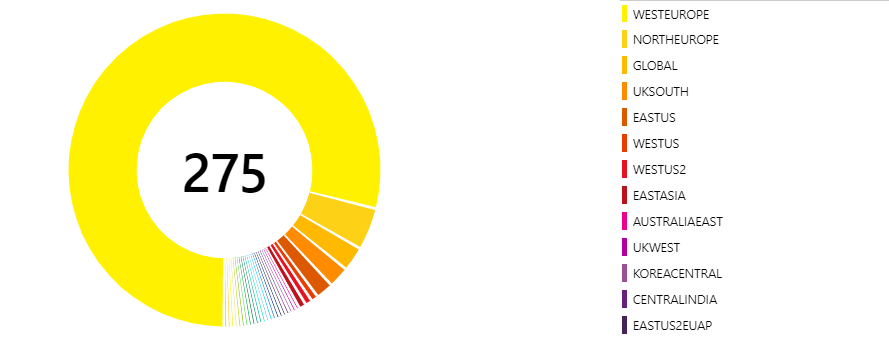
While we do get a chart, the point about too many data points is valid. We have many regions with only 1 item in, so let’s amend the query to remove those.
summarize count() by location | project location, total=count_| order by total desc
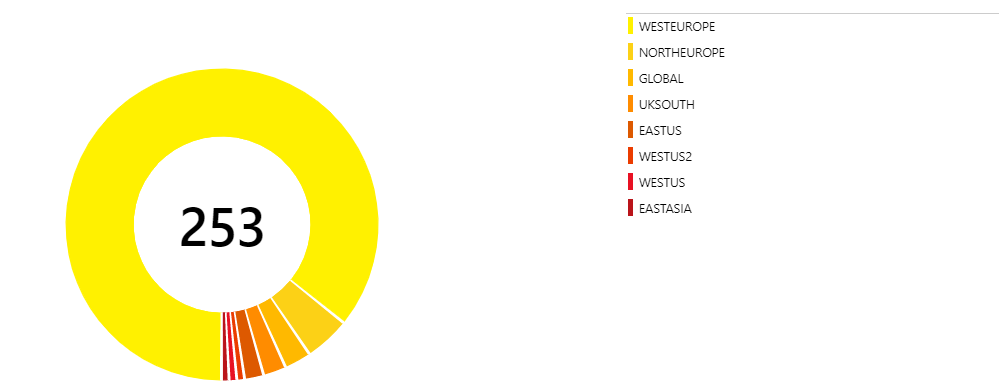
| where total > 1
This query gives a much more readable chart
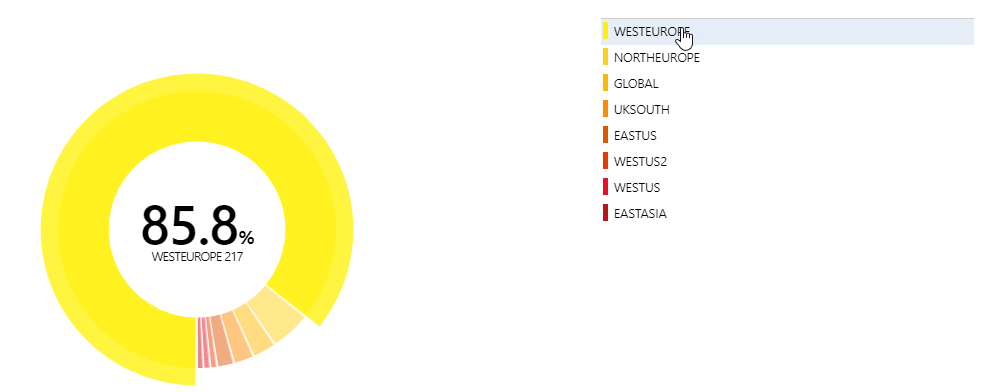
The chart is interactive, so you can hover over each region and get data about that specific slice.
This is a relatively simple query; you can use the query explorer to create more complex queries and turn these into charts. Hopefully, we will see the addition of more chart options soon.
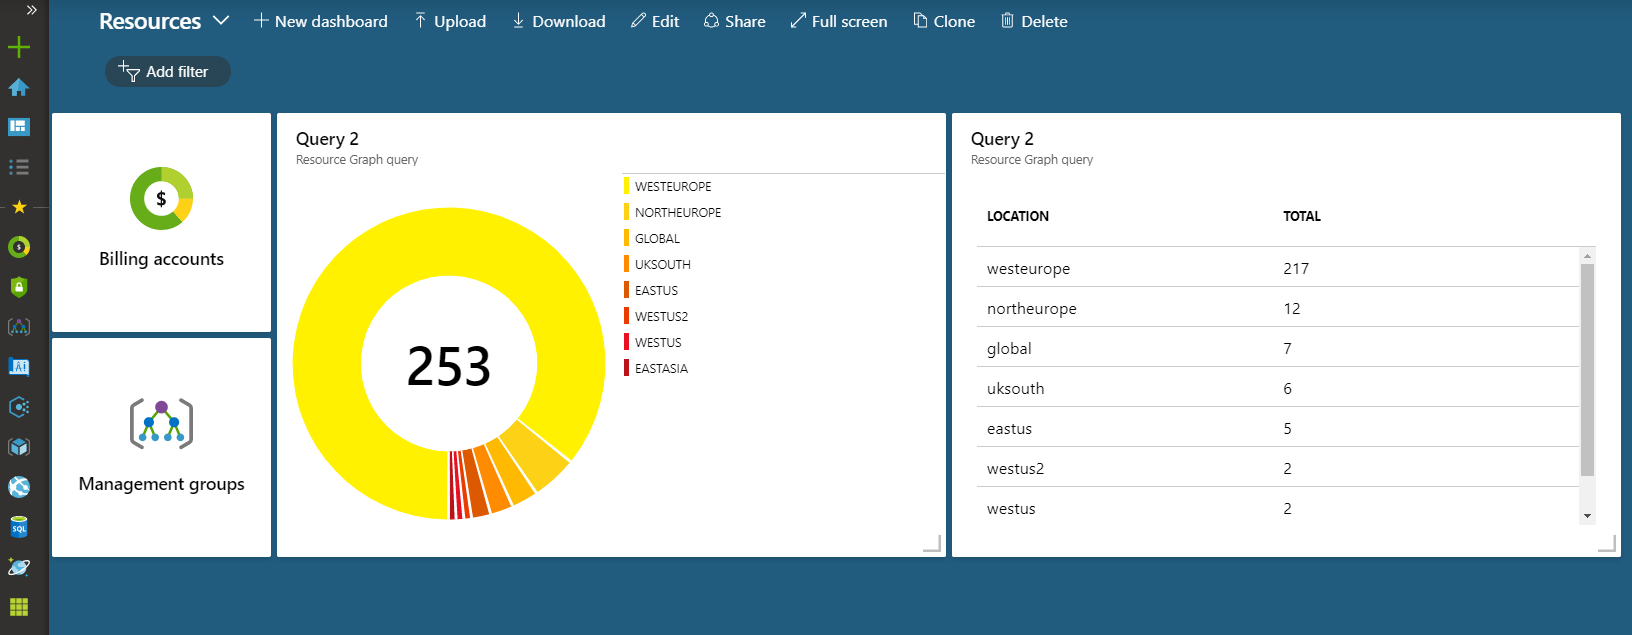
Azure Dashboard
Now that we can run queries and create charts in the portal, we can also pin the results of these to an Azure Dashboard. Pinning allows us to create a Dashboard that shows the overall view of our Azure estate, or maybe add this to some of our monitoring dashboards. Once created, these dashboards can be shared with others in your organization.
To pin either the results of a query or a chart to a dashboard, you click the “Pin to Dashboard” icon in the results view.

This will then pin the chart to your currently selected dashboard, so make sure you have the right one selected in the portal.