Troubleshoot Azure NSG issues with Network Watcher
At some point, I imagine most people working with Azure VMs have hit issues with being able to connect to services running inside a vNet. A lot of the time these issues boil down to the configuration of Network Security Groups to allow traffic into the VM. The process of troubleshooting these issues and determining which NSG and which NSG rule is at fault can be time-consuming, especially with complex networks.
Network Watcher is a relatively new set of tools that can be used to investigate issues with Azure Network connectivity. In this article, we are going to take a look at using this to examine problems with NSG rules preventing access.
Enable Network Watcher
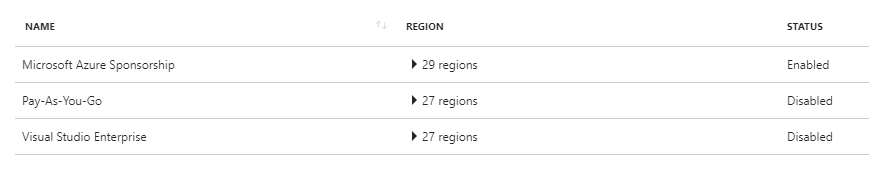
Before doing most things with Network Watcher, it needs to be enabled on the subscription you are interested in. To do this in the portal, browse to the Network Watcher product, then on the overview page, you will see a list of your subscriptions and whether or not Network Watcher is enabled. Select the subscription you are interested in and click Enable.
Security Group View
Now that we have Network Watcher up and running, the first thing I would look at to resolve an NSG issue is the “Security Group View”. This tool allows you to see the effective NSG configuration for the VM, the combination of all NSG rules applied to it. It also allows you to see what rules are coming from the subnet and which are directly assigned to the VM. You can also see which rules you have added and which are the default.
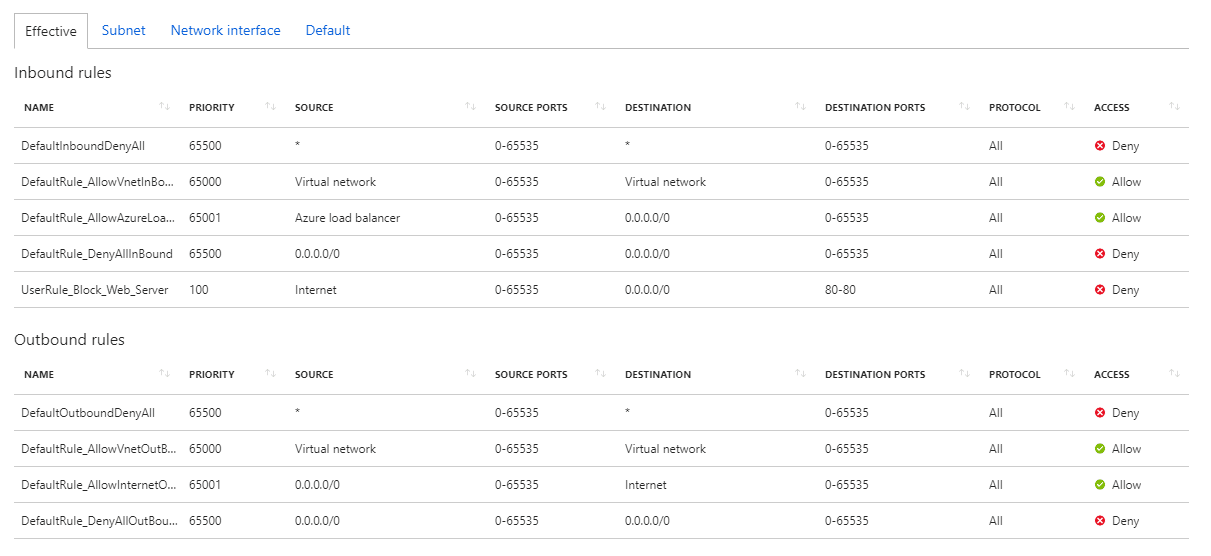
By using this tool, you can see what NSGs rules are in effect and hopefully spot the one that is causing the issue. If not, we can move on to the next tool.
IP Flow Verify
The next tool allows us to test the flow of traffic to a specific port, both inbound to a VM or outbound from the VM. Select the IP Flow Verify tool and then use the drop down boxes to select the VM you are interested in testing. The inbound or outbound IP of the VM should be filled in for you (depending on which direction you choose), you then need to fill in the port you are looking to test on the VM, and the IP and port at the other end of the connection.
In this example, we want to test inbound connectivity to port 80 on the VM. The local IP is that of the VM, the local port is port 80. The remote IP and port don’t really matter here, as they are not involved in the rule we want to test, however, if your NSG filtered on source IP and/or port then you would want to set these appropriately. In our case, I am going to use my public IP and a high port. Once we click “check” Network Watcher will go off and try and make the connection. If it fails, and the failure is down to an NSG blocking the traffic then it will tell you the name of the NSG rule that prevented it.

This information should then lead you directly to the rule that is causing the issue. If you have multiple rules blocking the port, you may find that it is still blocked and you need to repeat the test to get the next rule that is causing issues.
NSG Flow Logs
For most people, I expect the flow verify tool will be enough. However, if you want to get more detailed information on what your NSGs are doing, want to manually investigate issues, or want to feed data into other logging systems, then NSG Flow Logs can help.
When you enable NSG flow logs, Network Watcher will log actions taken by your NSG rules (both allow and deny) to files in an Azure storage account. These files will contain JSON data detailing the NSG activity.
Enable Flow Logs
To enable flow logs, go to the “NSG Flow Logs” option in the diagnostic section of Network Watcher and pick the NSG you are interested in collecting logs for. Confirm this the correct NSG and set the flow logs status to “On”. You will then be asked to select the storage account to send the logs to (you can select an existing one or create a new one) and set the retention period for these logs. You also have the option to enable “Traffic Analytics”, this sends your flow logs to an OMS/Log Analytics workspace and generates some visualisations based on this data. If you want to ingest your log data into Log Analytics, this is a good option to enable, but bear in mind it can have an impact on your Log Analytics charges.

Reading Flow Log Data
Once you enable flow logs, you will need to wait a little while for data to start appearing. Once it does you can look in the storage account you configured, and you should see a container called “insights-logs-networksecuritygroupflowevent”. Inside this container will be subfolders (a lot of subfolders) for the resource ID and the date and time and then mac address of the machine. Once you get down to the time window you are looking for and identify the machine you want, you will see a file called “PT1H.json”. Opening this file, you will see some events, each of which contains information about a particular flow. Below is an example from the VM with the same block rule on port 80.
{
    "time": "2018-08-21T15:27:07.6173177Z",
    "systemId": "7a7f44b0-f366-471f-9e04-a8cce8a93a73",
    "category": "NetworkSecurityGroupFlowEvent",
    "resourceId": "/SUBSCRIPTIONS/469048F1-92AF-4C71-A63B-330EC31D2B82/RESOURCEGROUPS/BSERIESDEMO/PROVIDERS/MICROSOFT.NETWORK/NETWORKSECURITYGROUPS/BSERIESDEMO-NSG",
    "operationName": "NetworkSecurityGroupFlowEvents",
    "properties": {
        "Version": 1,
        "flows": [
            {
                "rule": "UserRule_Block_Web_Server",
                "flows": [
                    {
                        "mac": "000D3A2C9BF3",
                        "flowTuples": [
                            "1534865202,200.100.50.25,10.1.1.4,53460,80,T,I,D",
                            "1534865202,200.100.50.25,10.1.1.4,53459,80,T,I,D",
                            "1534865202,200.100.50.25,10.1.1.4,53461,80,T,I,D",
                            "1534865205,200.100.50.25,10.1.1.4,53459,80,T,I,D",
                            "1534865205,200.100.50.25,10.1.1.4,53460,80,T,I,D",
                            "1534865205,200.100.50.25,10.1.1.4,53461,80,T,I,D",
                            "1534865211,200.100.50.25,10.1.1.4,53459,80,T,I,D",
                            "1534865211,200.100.50.25,10.1.1.4,53460,80,T,I,D",
                            "1534865211,200.100.50.25,10.1.1.4,53461,80,T,I,D"
                        ]
                    }
                ]
            }
        ]
    }
The first part of the record gives us some information on when the event occurred, what type of event it is and what resource it occurred on. The interesting data is in the “flows section” where we can see what it calls “tuples” for each connection attempt. This section is where we can see what happened to the request. Let’s take one of these and break it down.
"1534865202,200.100.50.25,10.1.1.4,53460,80,T,I,D",
This line contains eight pieces of data:
- 1534865211 - the timestamp of when this occurred
- 200.100.50.25 - the source IP the request came from (in this case my machine)
- 10.1.1.4 - the destination address, the VM
- 53461 - the source port
- 80 - the destination port
- T - Protocol, can be T for TCP, U for UDP
- I - Direction of Traffic, I for inbound, O for outbound
- D - What occurred to that traffic, A for allowed or D for denied
So we can see from this data that I made a request to port 80, and that request was blocked. We can see from the header information that this was blocked by the “Block_Web_Server” rule, which is a user-created rule.
Traffic Analytics
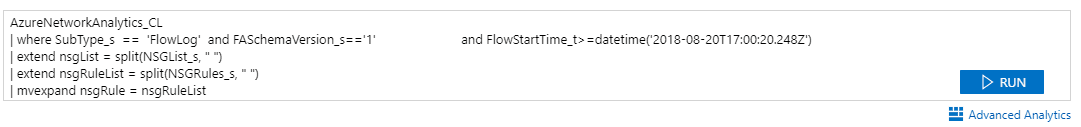
When we setup flow logs, we also enabled Trafic Analytics, which sent the data to Log Analytics and provided some custom visuals. We can view this data by going back to Network Watcher in the portal and clicking on “Traffic Analytics” under the logs section. This will launch the traffic analytics dashboard which provides visual data on what has been happening with your NSG’s.

You can click on any of the charts in this dashboard, and it will take you to Log Analytics and display the appropriate query that generated them. So if you wanted to do some more detailed querying of your flow log data, you could do so here. Or, if you want to use Log Analytics rather than the JSON file in the storage account to access the data, this gives you that option.
You can also use Traffic Analytics to get some more information about where your traffic, and potential attacks, are coming from using the map features.

Summary
Network watcher has a lot of useful tools to help investigate and diagnose network issues in Azure. We’ve just focused on looking at troubleshooting NSGs, but this can be one of the more frustrating areas to find problems. Hopefully knowing about these tools when you encounter these sort of issues will save you some time.
Image Attribution
Patch flickr photo by Craig A Rodway shared under a Creative Commons (BY-NC-ND) license