Finally, Cheaper Options for Azure Monitor Logs!
Azure Monitor Logs, or Log Analytics as many people will know it, is an excellent solution for collecting, aggregating, processing and alerting on your log data. However, it often surprises people how quickly costs for this log data can escalate once you start ingesting data regularly. Charges of multiple thousands a month for log data is not unheard of. One of the worst culprits is if you enable container log ingestion from AKS. Container logs can be very verbose and can spike log charges very quickly.
Up till now, there has only been one cost option for log data, but this week Microsoft announced a whole set of changes coming to Log Analytics/Azure Monitor Logs, including two options for reducing cost:
- Basic Logs - allowing you to reduce the ingestion cost of specific tables at the price of reduced functionality
- Archive Logs - allowing you to archive older data that does not need to be accessed regularly to cheaper storage
These options are currently in preview but are available to try out now. I’ve included some pricing details below as well, but you can see the full details Pricing – Azure Monitor | Microsoft Azure
Basic Logs
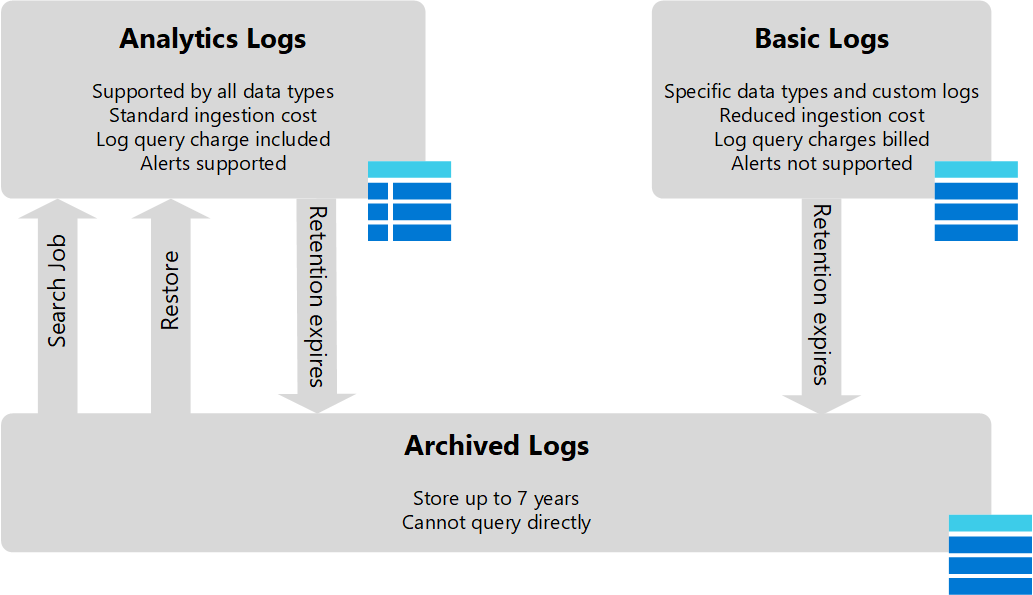
The first option is the introduction of “Basic Logs”. This sits alongside the current option, called “Analytics Logs”. Basic logs allow you to designate specific tables in your Log Analytics workspace as “basic”. This then means that the cost of the data ingestion is reduced; however, some of the features of Log Analytics are not available on that data. This means that you cannot configure alerts on this data, and the options for querying the data are limited. You also pay a cost for running a query against the data. Here are the full details of what you can and cannot do with each type:
| Category | Analytics Logs | Basic Logs |
|---|---|---|
| Ingestion | cost for ingestion. | Reduced cost for ingestion. |
| Log queries | No additional cost. Full query language. | Additional cost. Subset of query language. |
| Retention | Configure retention from 30 days to 750 days. | Retention fixed at 8 days. |
| Alerts | Supported. | Not supported. |
Basic Logs are best suited for data that is less likely to need querying against and doesn’t need to be retained for a long time. Debug data is a great candidate for this; it’s data you will probably only query if there is a problem and don’t need to keep for a long time. Container logs are a great example of this. Verbose container log data can be extensive in size but is only really looked at when there is an issue and is not generally something you need to keep for a long time.
Pricing for Basic Logs is $0.615 per GB ingested, compared to $2.76 per GB ingested for Analytics tables, so a reasonably significant saving. Querying the data in a basic table costs $0.007 per GB of data scanned. Analytics tables query data is included in the ingestion cost. These prices were correct at the time of publishing, please check the Azure Monitor pricing page.
There are restrictions on which tables you can turn into basic log tables, as you can’t do this for any data which Azure Monitor relies on to provide specific features for the platform. Currently, it supports the following:
- Any tables that are created from ingesting data using the custom logs API, so custom data you are collecting that is not directly used by Azure Monitor
- ContainerLog and ContainerLogv2 tables, which are used to store full container logs ingested from AKS
- App Trace tables which are used for storing trace data from Log Analytics
So it’s not a massive set of tables that support this currently, but I would expect it to grow over time. The one I suspect that will be the most beneficial and that will see the most uptake is the container log tables.
Enabling Basic Logs
There isn’t a UI or CLI/PS command for setting this up, only the REST API. The simplest way to set this up would be using the Azure CLI’s AZ REST command.
az login
az rest --uri https://management.azure.com/subscriptions/<subscriptionId>/resourcegroups/<resourceGroupName>/providers/Microsoft.OperationalInsights/workspaces/<workspaceName>/tables/<tableName>?api-version=2021-12-01-preview --method patch --body "{ \"properties\": {\"plan\": \"Basic\"  }}"
You can switch back to analytics mode by changing the plan name to “Analytics”:
https://management.azure.com/subscriptions/<subscriptionId>/resourcegroups/<resourceGroupName>/providers/Microsoft.OperationalInsights/workspaces/<workspaceName>/tables/<tableName>?api-version=2021-12-01-preview --method patch --body "{ \"properties\": {\"plan\": \"Analytics\" }}"
Archive Logs
The second change is adding an option for archiving logs. It is often necessary to keep certain logs for an extended period due to company or regulatory requirements. Log Analytics does support retention of logs for up to two years, but you pay a retention cost that is relatively high because the data is kept in live tables that can be accessed at any time.
Archive logs allow you to move the data into an offline state where it cannot be accessed directly but is significantly cheaper. Archive data is charged at $0.025 per GB per month, compared to $0.12 per GB per month for standard data retention. If you need to access the archive data, you pay an additional fee for either querying the archive or restoring it to active tables. This costs $0.007 per GB of data scanned for querying or $0.123 per GB per day of data restored (so effectively the same as standard data retention.). These prices were correct at the time of publishing, please check the Azure Monitor pricing page.
Data archiving is done by setting a retention policy at the workspace or table level. When data reaches the age specified in the retention policy, it is automatically moved to archive storage.
During the preview, the retention policy for archiving can only be set at the table level. The retention policy at the workspace still functions as it always has and deletes the data after the retention period is up.
As with basic logs, table level retention can only be set up using the REST API. We will use the AZ REST command again with this.
View Current Table Retention
az rest --uri https://management.azure.com/subscriptions/<subscriptionId>/resourcegroups/<resourceGroupName>/providers/Microsoft.OperationalInsights/workspaces/<workspaceName>/tables/<tableName>?api-version=2021-12-01-preview --method get
to view the retention for all tables, run the same query, but drop the table name:
az rest --uri https://management.azure.com/subscriptions/<subscriptionId>/resourcegroups/<resourceGroupName>/providers/Microsoft.OperationalInsights/workspaces/<workspaceName>/tables?api-version=2021-12-01-preview --method get
Set Table Retention
To set the retention, you need to send a PATCH request with the body containing JSON that sets two items:
- retentionInDays - this is your standard, non-archive retention. It can be set to null to take the value from the workspace
- totalRetentionInDays - this is the total retention including both archive and non-archive retention
So if we wanted to keep data active for 30 days and archived for 180 days, it would look something like this:
{
    "properties": {
        "retentionInDays": 30,
        "totalRetentionInDays": 210
    }
}
Note that total retention is non-archive plus archive time.
To set this using the REST API, we would run.
az rest --uri https://management.azure.com/subscriptions/<subscriptionId>/resourcegroups/<resourceGroupName>/providers/Microsoft.OperationalInsights/workspaces/<workspaceName>/tables/<tableName>?api-version=2021-12-01-preview --method patch --body "{\"properties\": {\"plan\": \"Basic\"{\"properties\": { \"retentionInDays\": 30,\"totalRetentionInDays\": 210}}}}"
We should get a response back that confirms those retention values, including explicitly calling out the archive time.
{
    "properties": {
        "retentionInDays": 30,
        "totalRetentionInDays": 210,
        "archiveRetentionInDays": 180,
        ...
    },
   ...
}