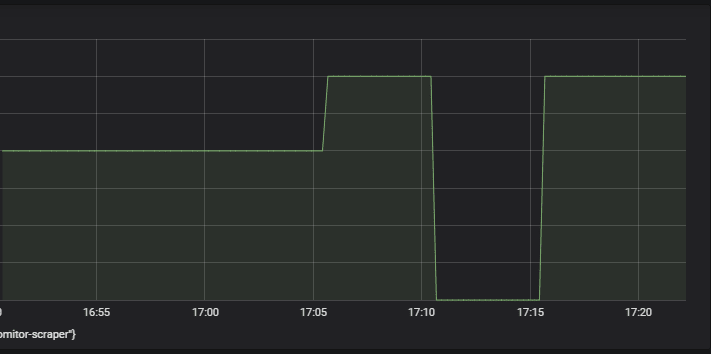
Prometheus has become the default metrics collection mechanism for use in a Kubernetes cluster, providing a way to collect the time series metrics for your pods, nodes and clusters. This metric collection allows you to monitor for issues, review performance over time, and also provide metrics to be used by the scaling functionality in Kubernetes. Both the Pod and Cluster auto-scaler can take custom metrics from Prometheus and use these to determine if they can scale out.
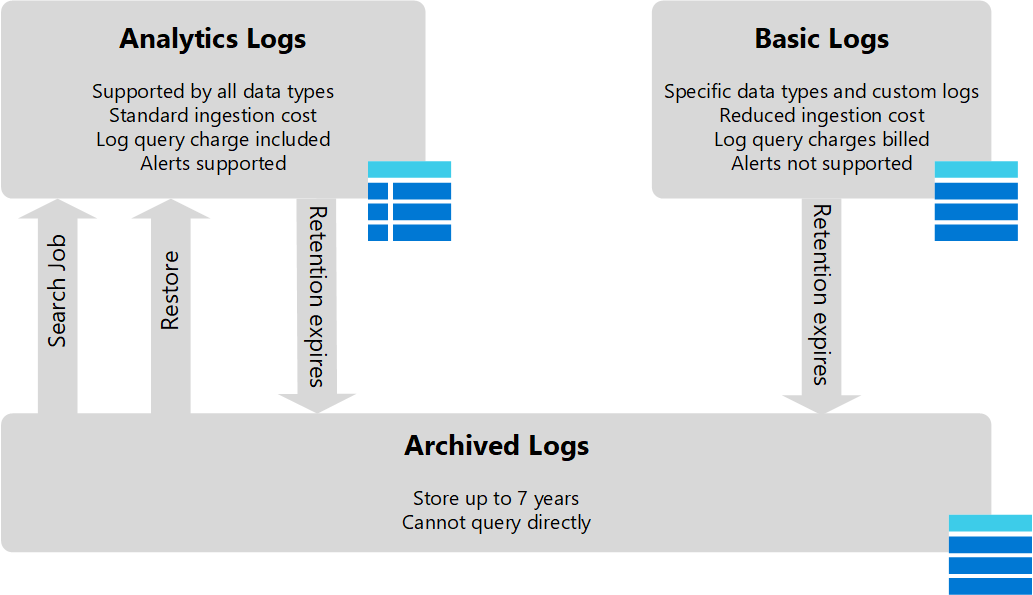
Monitoring your resources is vital to being able to detect issues or opportunities for performance improvements. When it comes to Azure the monitoring story can be a bit confusing with multiple different services seeming to offer similar or related solutions. In particular there is often confusion between two services, Azure Monitor and Log Analytics (part of the OMS suite). We’re going to take a look at these two services and when you would use them.